Securities Code : NASDAQ:ROKU
Chart Type : Normal Candlestick Chart
Resolution : Daily Chart
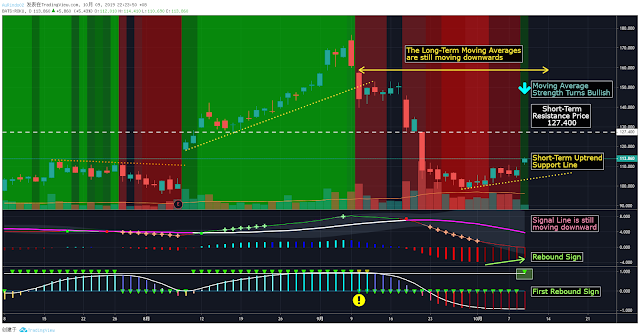
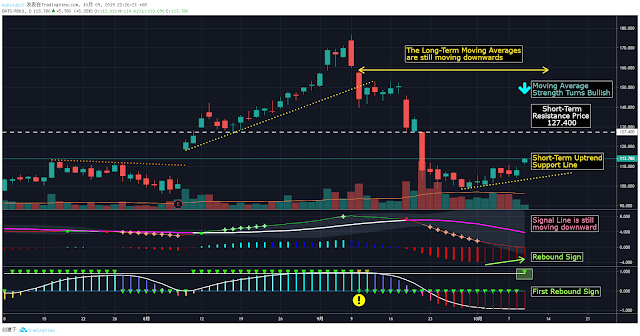
The current target and resistance price level for ROKU is located at 127.400 as marked as the white dotted horizontal line around the relative highest point of that big red candlestick which could be the current target price level to be challenged by ROKU recently from the rebound trend.
Disclaimer:
This is just a haring of personal experience and I will not have ant responsibilities for the gain or loss on your investment action.
Chart Type : Normal Candlestick Chart
Resolution : Daily Chart
 |
| Picture 1 ROKU Daily Candlestick Chart |
The current target and resistance price level for ROKU is located at 127.400 as marked as the white dotted horizontal line around the relative highest point of that big red candlestick which could be the current target price level to be challenged by ROKU recently from the rebound trend.
I’m preferring to set the short-term support line at the price level of 100 as it has a much significant physiologic effect and also it is much easier to be handle when it is necessary to use it during mathematical calculation.
We are also able to observe that the ROKU’s chart form a gap currently which can be considered as a good starting point for it to has a high possibility to rebound from now on. Besides, the magnitude of this gap is much significant than the previous one on early-October as the price of this candle regarding is it opening price or lowest price was higher than any prices from 23rd September, the trading day after the tremendous red candle formed.
In order to maintain the rebound phase, it must either fulfill either that the price remain above 127.4 or remain above the short-term uptrend support line as shown as the orange uptrend line.
From the indicators’ perspective, the multiples moving average strength turned bullish during the trading hour price on this morning(until this analysis has finished) as today is the first day that the background of ROKU turned green from red. Recently it is still rebounding but the long-term moving averages like those Mas above 50-days are moving downwards too which might act as multiple layers of resistance and pressuring the potential rebound force.
Apart from that, histogram of MACD is increasing now below zero line and the stochastic oscillator showed the first sign of rebound together today. Combination of these situation leads represents the primary rebound trend for ROKU. However the divergence between MACD and signal line is wide while the signal line is still moving downward which might pressure the strength and momentum of the uptrend and therefore, I choose to rebound over the uptrend from now on until the further price level breakout at 127.400.
 |
| Picture 2 ROKU Daily Candlestick Chart (Clear Background) |
This is just a haring of personal experience and I will not have ant responsibilities for the gain or loss on your investment action.
UTAR精算学研究计划 SOA 考试 LTAM 的时间管理 自 2022 年以来 SOA 精算考试结构的变化 内部收益率计算指南 使用 Ti30XB 进行二项分布计算
Tags:
Analysis
