Securities Name : YTLREIT
Disclaimer:
This is just a haring of personal experience and I will not have ant responsibilities for the gain or loss on your investment action.
Securities Code : 5109
Chart Type : Normal Candlestick Chart
Resolution : Daily Chart
TECHNICAL ANALYSIS OF YTLREIT MYX:5109
|
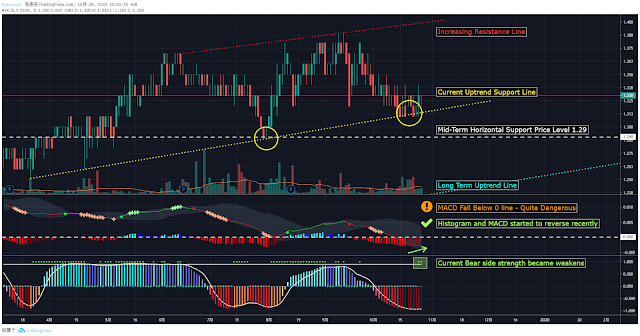
From the chart above , we are able to presume that YTLREIT have been entering into a uniform channel between the Red Line - Increasing Resistance Line and Yellow Line - Current Uptrend Support Line and the current price level is supported on the support region as shown as the 2nd yellow circle on the same trend line.We are also able to observe that the Mid-Term support price level is 1.29 which is represents by the White Line and it acts as the second protection layer for YTLREIT to maintain it price above the area of RM1.30.
If the price level fails to hold on the White Line firmly, the next target area or support price area will be revised downwards to the Cyan Color Long Term Uptrend Line in the future based on the time it approach. The Cyan Line was drawn by joining the trend between the lowest price of candlesticks on April 2018 and December 2018.
For the prediction part, there are high possibilities for it to rebound from the current price level to 1.35 or 1.36 in short term as the pressure to breakthrough Yellow Line is tremendous and requires participation of huge volume to achieve this condition.
From the technical indicators perspective, the MACD line moved below zero line for quite some time which is not a good sign for it to has a outstanding bull side trend or even maintain the swing above the White or Yellow Line in short term. However, both MACD and its Histogram had started to reverse from bearish trend recently which indicates a possible price rebound which the effect would be much effective if MACD is able to move back above 0 line or Histogram turns cyan.Besides, the Stochastic Oscillator shows a early sign of price rebound which is represents by the box where the lime triangles shown. This condition indicates that the bearish power on the price movement weaken for few trading days until further confirmation is shown.
Besides, from the additional references on the picture below, the candlesticks for the last two trading days showed that the price movement escaped from the bearish trend which the background became invisible from the red background.
As conclusion, the price of YTLREIT has high possibilities to maintain above the Yellow Line or White Line which the short-term target price can be aim at 1.35-1.36 recently.
Additional References
 |
| Picture 2 YTLREIT Daily Candlestick Chart (With M.A.s Background) |
Disclaimer:
This is just a haring of personal experience and I will not have ant responsibilities for the gain or loss on your investment action.
参加SOA考试IFM前的时间安排和通过计算练习来学习考试IFM的方法。 如何支付 SOA 考试注册费用 如何通过 Prometric 安排考试中心和时间 分享3小时通过SOA考试IFM的方法 SOA考试高分通过后报销
Tags:
Analysis

